Trusted by finance teams


What financial controllers struggle with daily
Manually rebuilding the same reports every month in Excel
A single #REF! error that cascades through 12 tabs
The board asks for a new insight, and it costs you half a day
A colleague leaves and no one understands the Excel model
What's in it for you
Reports that calculate the way you set them up, and figures that are correct without you having to double-check anything.
Reports that adapt to you
Build reports with your own structure, dimensions, and formulas. Adjust them as fast as your business changes, no rigid templates, no consultants required.
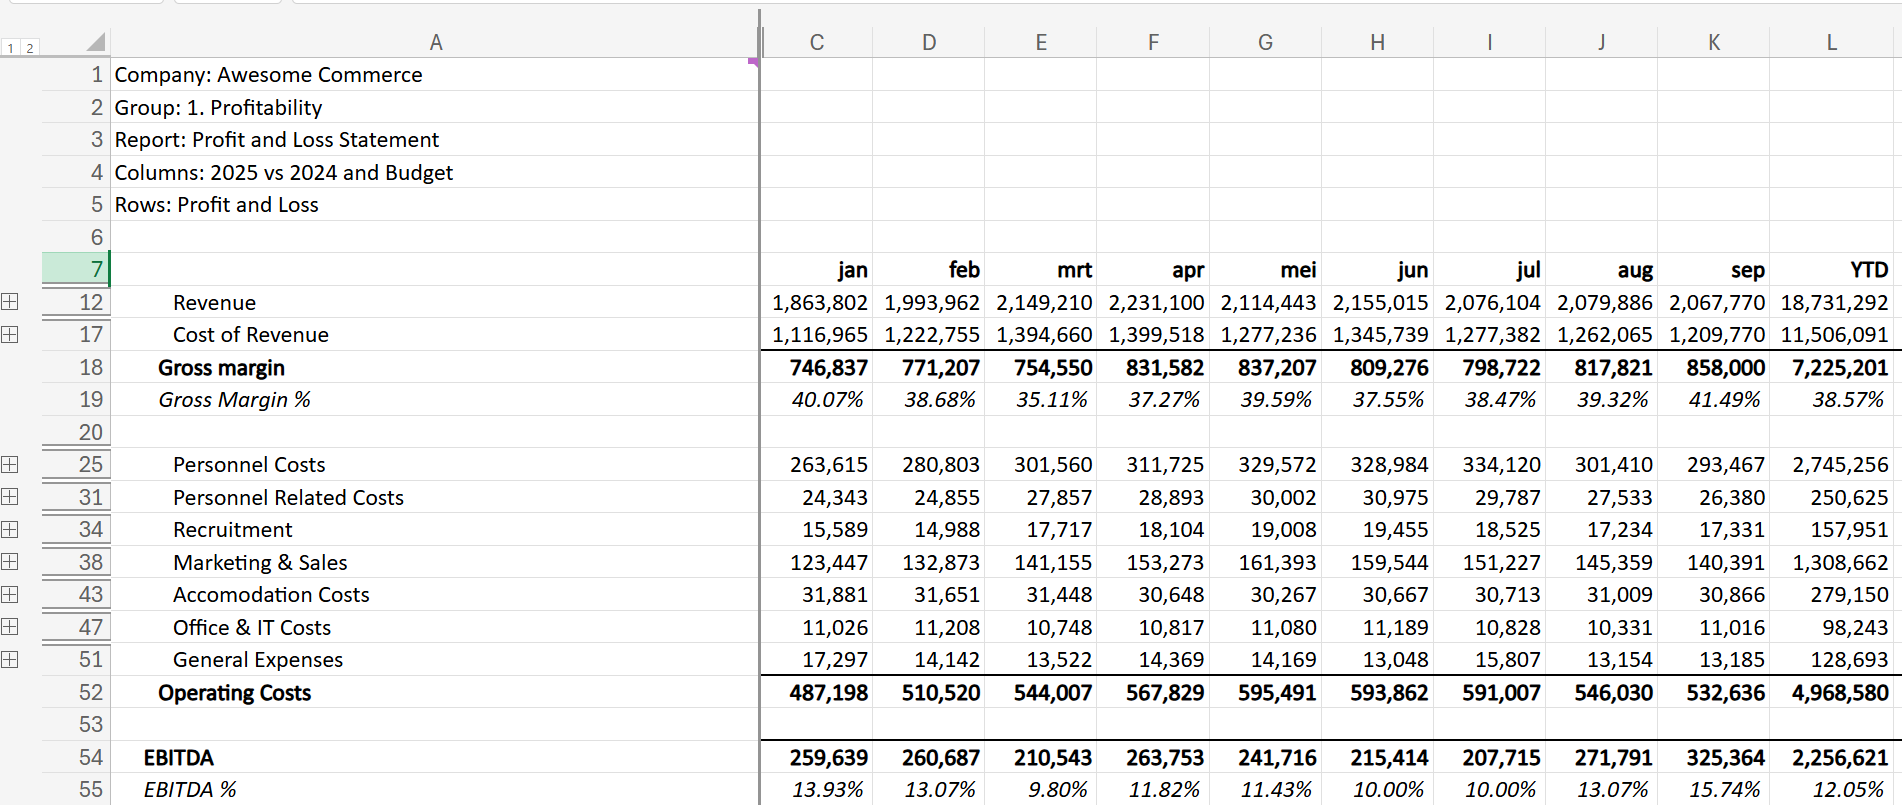
From group report to original invoice
Drill down from consolidated report to entity, ledger, transaction, and the PDF underneath. Every number is always traceable to its source.
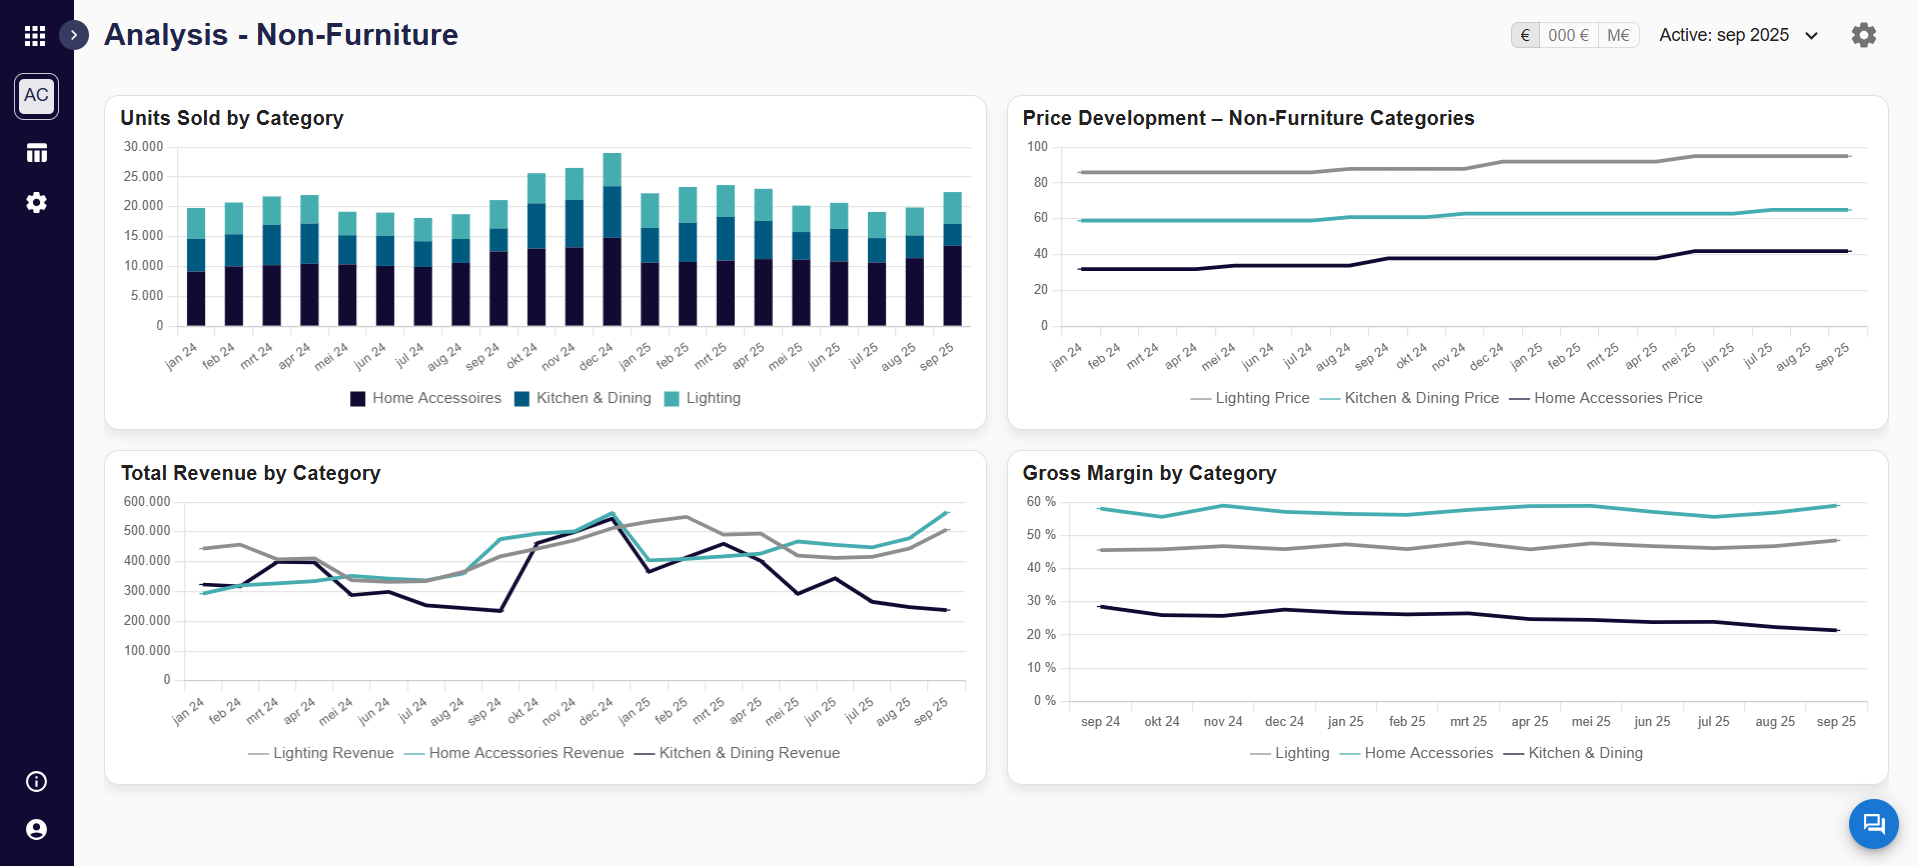
One source for all reports
Financial figures, operational metrics, and dimensions, all in one system. No more scraping numbers together from separate sources, but automatically combined in Smartbooks.
Your reports, always up to date
Build your own reports and adjust them whenever you need to.
- Define your own reporting structure and adjust it at any time
- Report by cost center, project or cost driver
- Real-time sync with your accounting system, no exports or manual updates
- Quickly add new reports and KPIs whenever you need them
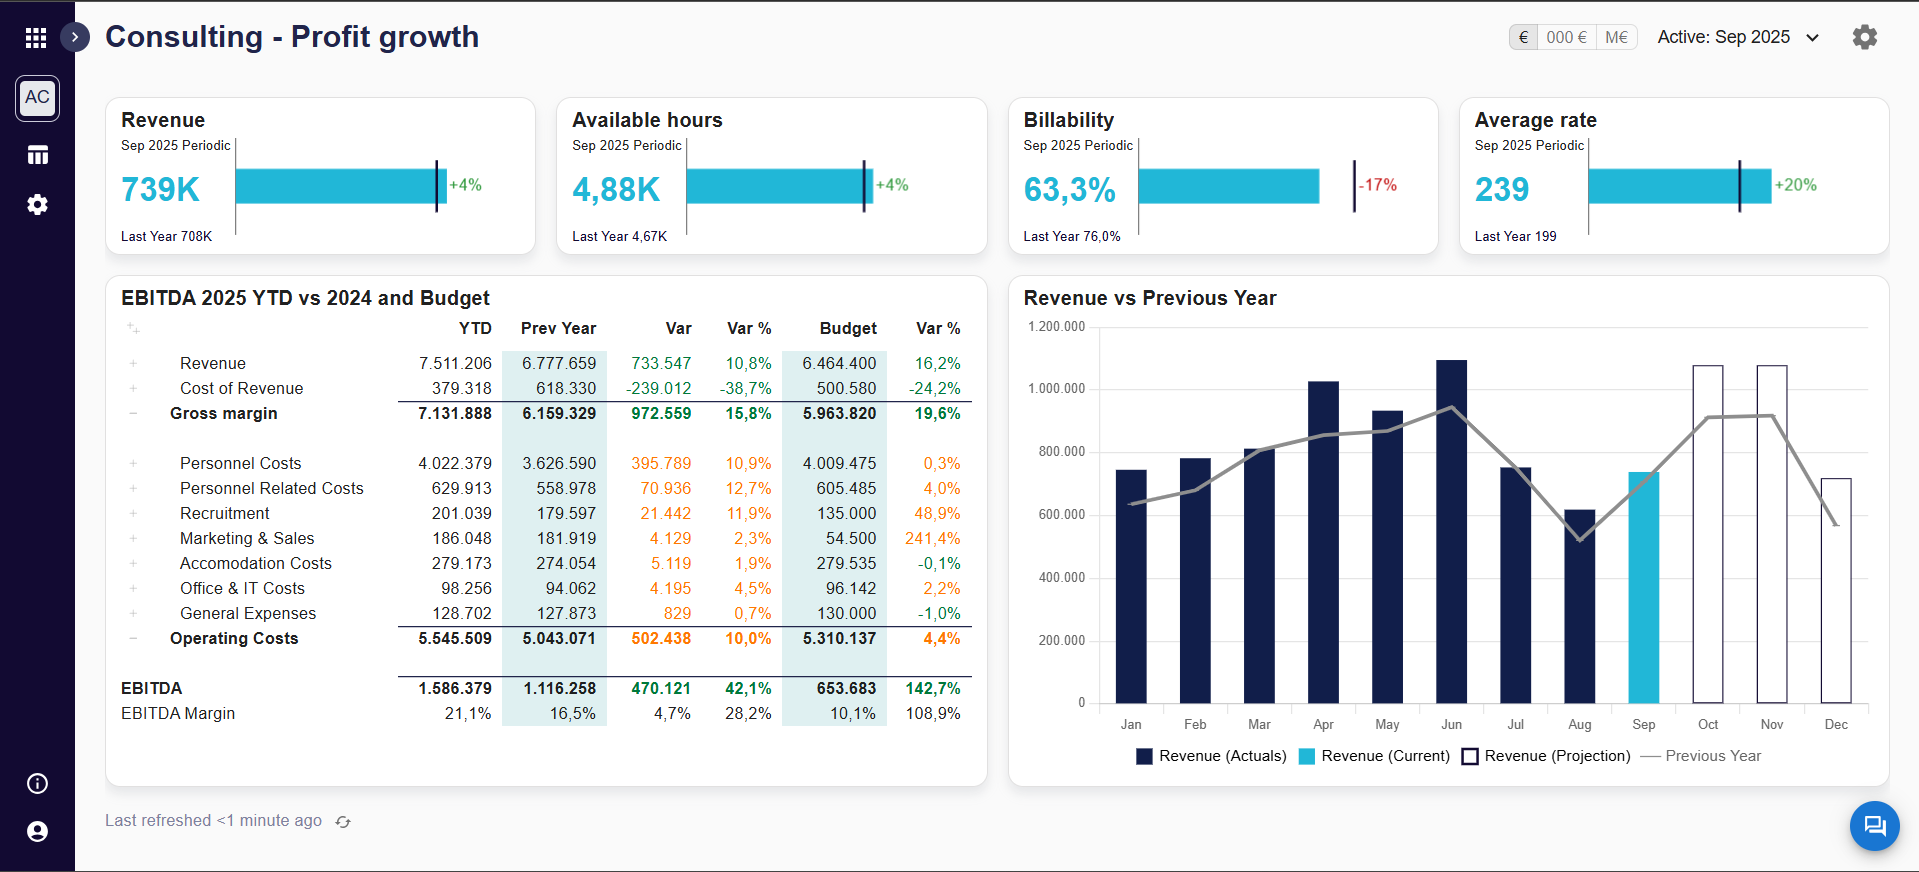
Dashboards with financial and operational figures
One dashboard with both financial and operational figures, so the management team reads a single picture instead of a stack of PDFs.
- KPI tiles with comparison (budget, prior year, prior period) and trendline
- Operational metrics alongside financial figures, via input, formula or API
- Multiple dashboards per audience: board, MT, operations
From report line to PDF invoice. In three clicks.
A deviation in your numbers? Click through from report to ledger to the original invoice. All analysis inside Smartbooks, no need to go back to your accounting system.
- Drill-down from report to ledger, transaction and PDF
- Quick view of all transactions to or from a specific customer over a period
- Works at entity and consolidated level
Excel doesn't have to go. Just not as the source anymore.
Standard processes run in Smartbooks, your ad-hoc work in Excel, with live data and no copy-paste.
- Live Smartbooks data directly in Excel
- Always refreshable, never doubt whether your figures are current
Decide who sees what. With the role model (Viewer, Contributor, Admin) and restrictions per cost center and report, you maintain control over who can view which information.
Connect your systems in minutes
Smartbooks plugs seamlessly into your existing accounting, ERP and BI stack. No IT project, no migration, just plug-and-play with the tools you already use.

Missing an integration? Almost any connection is possible via our API and integration platforms.
Data & BI


Systemen & automatisering
For BI tools and automation platforms we use open APIs and ready-made connectors.
More on reporting
Frequently asked about reporting
See Smartbooks in action
See Smartbooks in action, in 25 minutes
In our on-demand webinar we walk you step-by-step through automating consolidation, reporting and cash flow.
- Demo in a real multi-entity environment
- How to shorten your monthly close by days
- Real-world examples from finance teams like yours

Free Whitepaper
Discover in our whitepaper how AI is transforming the financial sector and how your organization can benefit.